Case Studies – Page 2 – Lean

Case Study: Tulip Cremation

Case Study: Tulip Cremation

Client Overview

Tulip is on a mission to reinvent the funeral-arrangement experience. They offer one simple cremation package that can be arranged online or over the phone, providing families with affordable and more convenient alternatives to traditional funeral homes.

The Challenge

Before we started working with the team, Tulip already had an active account for more than a year, but couldn’t scale due to the high cost per lead and CAC. They were also planning to expand to new locations and needed a partner that could support their rapid growth.

Strategy

We couldn’t track the end purchases with pixel-based conversion, so we had to rely on back-end data in order to optimize the campaigns. With different pricing strategies for each location, keyword, and both at-need and pre-need demand, we had to keep a tight account structure in order to connect the dots.

Smart bidding was all the hype as always, but by testing different bidding strategies we found that some keyword categories are more suitable for manual CPC, while others for Target CPA. We ended up with a hybrid strategy between manual and automated bidding, occasionally re-testing our approach.

Even with a good structure in place, our insights were limited because we were getting only a fraction of purchases on the platform. To get the real ROI from our campaigns we implemented and automated the process of offline conversion tracking (OCT) in Google Ads. This allowed us to be faster with re-allocating the spending based on performance and to maximize efficiency. OCT also allowed us to get purchase insights on demographic and ad level, as well as to do proper price sensitivity testing in each location.

Our biggest impact however came from our creative team and the ongoing messaging optimizations. On one side we were constantly battling and outsmarting our competitors for the most competitive “cremation” category, while on the other, we opened up new efficient volume by re-positioning ourselves for keywords like “mortuary” or “funeral”.

Results

With ever-rising competition, we still managed to keep our dominance in the California market, while successfully expanding to new locations, and are proud to say that we brought peace of mind in difficult times to thousands of families in the US.

Lastly, the focus of this case study and how we achieved the biggest impact is through our ad optimization process. Below are a few examples of our creative team at play.

For the funeral keyword category, we positioned the ads to filter out misguided users while still keeping high relevance. Our hypothesis was that by positioning Tulip as a funeral home, we were paying for clicks from people that were already sold on the classic funeral home experience. With the challenger ads, we made sure to clearly communicate our “cremation” offer, state why it’s the better option, and still mention “funeral” in order to stay relevant to the user’s searches. For example, on the left is a preview of the “old” ads that were running when we took over the account. And, on the right, is the ad positioning approach that helped us achieve 40% lower cost per lead and CAC, without sacrificing volume.

Tulip Cremation - Google Ads Case Study

For the mortuary keyword category, we tripled the purchase volume while getting 35% lower CPQ and 3x ROI!

Here, we employed the psychology of the Cognitive Bias called “Framing Effect”, which hypothesizes that people react to a particular choice in different ways depending on how it is presented, as a loss or as a gain. We took the previously winning ad headline that said “Cut the Mortuary Expenses” and reframed it to say “Mortuary Costs Included”. It was communicating the same value, but its framing made a huge difference.

Tulip Cremation - Google Ads Case Study

For the cremation-related terms, at one point we took a significant hit on the CTR and Lead volume from a new competitor that offered free cremation with body donation. Even though users were price sensitive, we managed to get back on track by focusing on our dignified cremation process and high-touch level of service. We also doubled down on the transparency of our pricing as most of our competitors had hidden fees.

Tulip Cremation - Google Ads Case Study

Andrej Vangelski

The author

Andrej Vangelski

Senior Account Lead and Partner @ Lean

They fired their creative agency and gave the performance creative to the team already running their Google and Meta ads

They fired their creative agency and gave the performance creative to the team already running their Google and Meta ads

Case study · Consumer membership marketplace · Google Ads, Meta and creative Once they'd seen the ownership we took and the results we drove,…
How cutting their  “best-performing” channel grew patients 112% at 52% lower cost

How cutting their “best-performing” channel grew patients 112% at 52% lower cost

Case study · Healthcare · Google Ads and Meta It was their best channel by every number they had. Every number they had stopped…
How the most heavily modelled account we'd inherited was hiding a 43% gain.

How the most heavily modelled account we'd inherited was hiding a 43% gain.

Case study · B2B SaaS · Self-serve signup · Google Ads and Performance Max The machines were doing a great job. The inputs underneath…

How cutting their “best-performing” channel grew patients 112% at 52% lower cost

How cutting their  “best-performing” channel grew patients 112% at 52% lower cost

Case study · Healthcare · Google Ads and Meta

It was their best channel by every number they had. Every number they had stopped too early.

The short answer

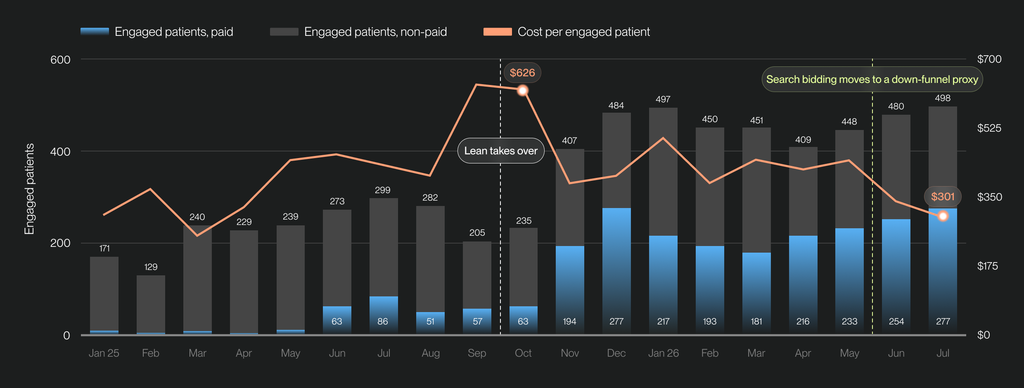
A healthcare business spending up to $250,000 a month had most of it in social, the channel with the best top-of-funnel numbers. Registrations were cheap and plentiful. Almost none became patients. Broken back-end tracking meant nobody could see that. We took over in October 2025, argued for moving the budget to search before anyone could prove we were right, then spent months fixing the tracking so search could bid on a proxy for an eligible patient. Engaged patients went from 235 a month to 498, and cost per patient from $626 to $301.

+112%

Engaged patients per month, 235 to 498

−52%

Cost per engaged patient, $626 to $301

October 2025July 2026Change
Engaged patients per month235498+112%
Cost per engaged patient$626$301−52%
Qualified registrations per month461966+110%
Cost per qualified registration$319$155−51%
Google cost per click$2.02$13.246.5x
Click to qualified registration rate0.93%4.64%5x

Who this is about

A healthcare business spending up to $250,000 a month across search and social. Someone registers, gets screened for eligibility, and then either reaches clinical care or doesn’t. The patient who reaches care is the one the business earns from, so that’s what the account is judged on. We took it over in October 2025, with most of the budget sitting in social.

Their reporting said social was the best channel. It wasn’t.

By every number the client had, social was working. Registrations were cheap and there were plenty of them. What nobody could see was what happened to those registrations afterwards, because the back-end tracking stopped at the sign-up. So the channel producing the most registrations looked like the best channel in the account, and the conversion everyone was judged on wasn’t the one that mattered.

The easy version of this job is to report against that number and hit the target. We told them their best channel was the problem instead, and asked to move the budget before anyone could prove it. If we were wrong we’d have cut their largest source of volume on a judgement call, and it would have been ours to answer for.

Reporting against a number we didn’t believe would have been safer. It wouldn’t have been right.

What made the difference

It took someone with skin in the game

None of this happens unless someone treats down-funnel revenue as their own problem. Reporting on platform data is fast and it always looks fine. Gluing back-end data to platform data by hand takes twice as long and tells you things you’d rather not know. The tracking fix wasn’t a marketing task at all, so it meant twice the meetings with their data team and months of chasing owners outside marketing who had their own roadmaps. An agency logs that as a client dependency and reports the blocker every week. We took it as ours.

We made the call before the data could prove it

We pulled what the back end did hold, filled the gaps with stand-in measures and with what accounts like this one usually do, and argued for a radical change in the budget split. It took a lot of pushing. When the reporting was rebuilt months later it confirmed the call. Search was converting into eligible patients at a rate social never came close to.

We taught search to bid on a proxy for a real patient

Once the tracking held we sent Google a down-funnel signal, a proxy for a registration that would turn out to be eligible. The algorithm stopped optimising for people who fill in a form and started optimising for people who qualify. It also got choosier, which is why cost per click climbed to $13.24. Click to qualified registration went from 0.93% to 4.64%.

Every platform will tell you it’s working. Only the back end can tell you which one is right.

Did the volume hold?

It doubled. 235 engaged patients in October 2025, 498 in July 2026. January against July is the cleanest read: 497 patients on around $250,000 of spend, then 498 on around $150,000. Same output, $100,000 less.

Questions we get asked

Should we move budget out of the channel with the best cost per lead?

Not on platform numbers alone, but don’t trust those numbers either. Check what each channel’s leads do downstream. The channel with the best cost per lead is often the one buying the least qualified people, and the platform will never tell you, because it can’t see past the click.

What do you do when the tracking is broken and you can’t prove which channel works?

You don’t wait. Pull whatever the back end does hold, fill the gaps with stand-in measures, and weigh that against what you’ve seen accounts of this shape do before. Say out loud that it isn’t certain, make the call anyway, and fix the reporting in parallel so you find out whether you were right. Waiting for clean data is a decision too, and usually a more expensive one.

Will optimising on a rarer event starve the algorithm of data?

It can, and that’s the whole reason to use a proxy rather than the final outcome. The event has to sit far enough down the funnel to correlate with value and happen often enough to feed the model.

Is a rising cost per click a bad sign?

On its own it’s neither good nor bad. It’s a price, not an outcome. Read it next to cost per outcome. Here cost per click rose 6.5 times while cost per engaged patient halved, which means the extra money was buying better people.

Client name withheld at the client’s request. All figures are actual reported results for the periods shown. Cost per engaged patient and cost per qualified registration are paid media spend divided by total volume from all sources.

Ivana Janevska

The author

Ivana Janevska

Account Lead and Partner @ Lean

They fired their creative agency and gave the performance creative to the team already running their Google and Meta ads

They fired their creative agency and gave the performance creative to the team already running their Google and Meta ads

Case study · Consumer membership marketplace · Google Ads, Meta and creative Once they'd seen the ownership we took and the results we drove,…
How the most heavily modelled account we'd inherited was hiding a 43% gain.

How the most heavily modelled account we'd inherited was hiding a 43% gain.

Case study · B2B SaaS · Self-serve signup · Google Ads and Performance Max The machines were doing a great job. The inputs underneath…
How 704 ad tests took monthly spend 10x with cost per enrollment down 46%

How 704 ad tests took monthly spend 10x with cost per enrollment down 46%

Case study · EdTech · Meta · Performance creative Nobody can pick the winning ad in advance, so we stopped trying to. The short…

How 704 ad tests took monthly spend 10x with cost per enrollment down 46%

How 704 ad tests took monthly spend 10x with cost per enrollment down 46%

Case study · EdTech · Meta · Performance creative

Nobody can pick the winning ad in advance, so we stopped trying to.

The short answer

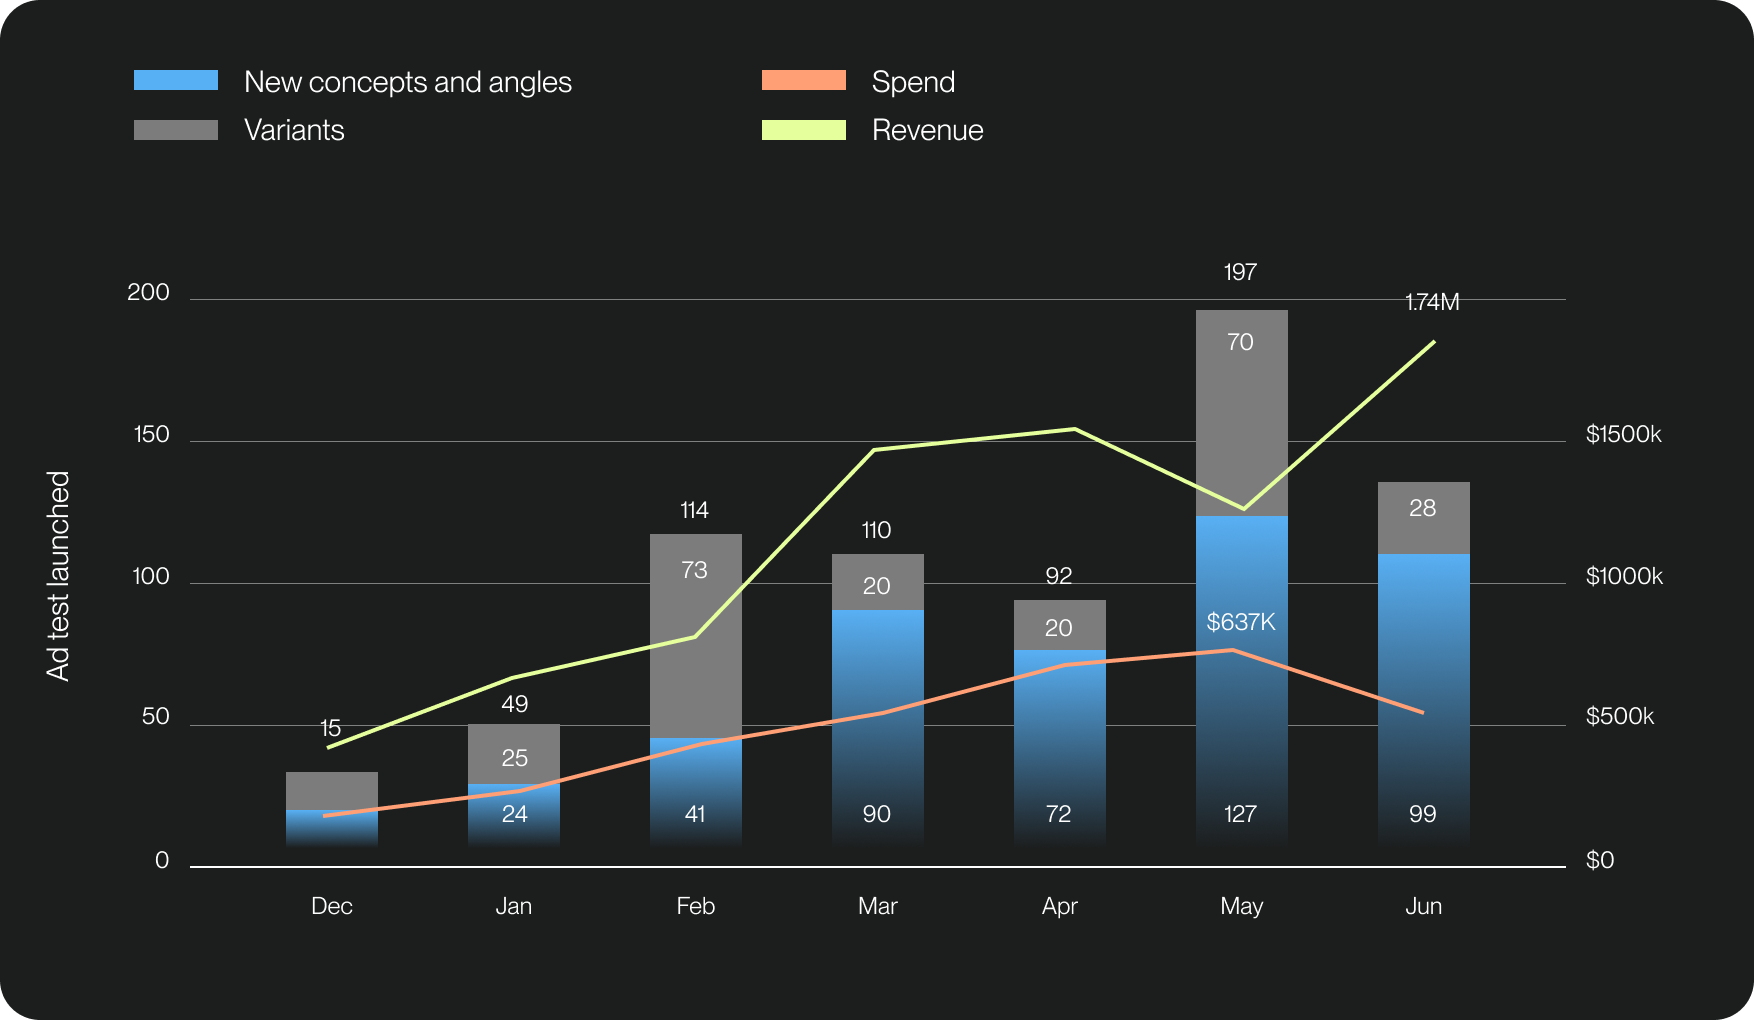
An EdTech client had no paid social history to build on. Over seven months we launched 704 ads, around 27 a week, each with a written hypothesis and a postmortem, because volume without either is just noise. Monthly spend scaled from $65,000 to a peak of $637,000, monthly revenue went from $377,000 to $1.74M, and cost per enrollment fell 46% as the budget grew almost ten-fold.

4.6x

Monthly revenue
$377K to $1.74M

9.8x

Monthly spend
$65K to $637K peak

−46%

Cost per enrollment
while spend scaled

704

Ad tests
461 new concepts, 243 variants

MonthNew conceptsVariantsTotal testsSpendRevenue
Dec 20258715$65K$377K
Jan 2026242549$185K$644K
Feb 20264173114$322K$795K
Mar 20269020110$438K$1.34M
Apr 2026722092$568K$1.44M
May 202612770197$637K$1.17M
Jun 20269928127$360K$1.74M
Total461243704

Isn’t 704 ad tests just spray and pray?

It’s the fair objection, and volume on its own would have produced nothing.

Most accounts fail in one of two directions. The first is over-investing in a handful of ads. Weeks of concepting, rounds of internal review, four beautiful launches. It wastes the opportunity, because nobody can identify the winning concept in advance. Not the strategist, not the designer, not the client. Limiting yourself to a few attempts is an expensive way to be confidently wrong.

The second is shipping everything to see what sticks. That produces the occasional winner and no knowledge, because without a stated hypothesis you can’t tell whether an ad won on the angle, the format, the offer or the timing. So you can’t do it again on purpose.

The split matters here. Of the 704 tests, 461 were new concepts or angles and 243 were variants of something already working. Two thirds of the output was a genuinely different idea rather than a resize or a colour change.

Nobody knows in advance what will win. That’s the argument for volume, and it’s also why every test needs a reason attached.

Who this is about

An EdTech business where the conversion that matters is an enrollment. Paid social hadn’t been used at any real scale before, so there was no library of proven ads, no history of which messaging worked, and nothing to build on.

What made this work

The design team sat under the performance team

One of the key factors behind volume, data driven hypotheses and fast testing is having the design under the performance team. Not a brand team operating on completely different KPIs. Not a creative agency that cares more about how the work looks than how it performs.

You need them working desk by desk, one Slack message apart. From the moment a data insight lands to the brief being written should take hours, not days or weeks.

At 27 ads a week, a week between reading the data and acting on it costs you a full round of tests.

Two senior people held the account every week, no rotation and no juniors. A performance lead who reads the whole funnel from CTR down to CAC and knows how the algorithm spends. A designer who turns the idea into something that does its job and builds statics and motion at test speed. Both answering to the same numbers, which in a lot of accounts is the whole difference.

Every hypothesis started from data

No spaghetti at the wall. Every concept started from something observed. Reddit threads and other external discussion where people talk about the decision in their own words. The client’s customer survey. The questionnaire applicants fill in when they apply, which is a large pile of first party language about what people want and what is stopping them.

Each of those sources produced several hypotheses rather than one, and we tested most of them. That is where a lot of the volume comes from. It is not 704 random ideas, it is a much smaller set of real signals worked through properly.

Every test got a postmortem

Results were read back against the hypothesis, not just against CPA. That’s the step that turns 704 launches into an accumulating body of knowledge instead of 704 separate events, and it’s the one almost everyone skips.

Questions we get asked

How many ads should you test at once?

Launch new ads as soon as you have enough signal to tell a loser from a winner. Not statistical confidence, directional data. There is no fixed number, it depends on how much signal your spend and conversion volume can carry. Ten ad tests in a week on $5,000 of spend and ten conversions is overkill: you spread the signal so thin that no ad gets the chance to show what it can do.

Is creative volume or creative quality more important?

Picking a side is how accounts stall. Over-thinking a handful of ads wastes the opportunity, because no one knows in advance what will win. Shipping everything without a hypothesis and a postmortem produces the occasional winner and no knowledge. This account grew because it did both at once: high output where every launch was a documented bet.

Who comes up with the concepts, the account lead or the designer?

Both, when they sit in the same team. The account lead is in the account daily, sees what is working and what is not, and reads the external and internal data. In our case they turn all of it into a dashboard that is friendly enough for designers to use, so the designers are looking at the same information. That is what lets them come up with concepts rather than execute briefs. It depends on the kind of designers you work with.

Client name withheld at the client’s request. All figures are actual reported results for the periods shown.

Ivana Mitevska

The author

Ivana Mitevska

Account Lead and Partner @ Lean

We Did Such a Great Job, We Got Fired.

We Did Such a Great Job, We Got Fired.

“The commitment to our company goals was impressive, even if it meant a shorter-term engagement” - Jamie Scarborough, Founding Partner at Sales Talent Agency…
This ad was never paused for 3 years! Here are the results.

This ad was never paused for 3 years! Here are the results.

Client Overview Bloomscape delivers fully-grown, ready-to-go plants to customer’s doors. In short, everything you’ll ever need as a plant parent & greenery lover. We…
Transforming ROI Measurement for Our Clients with LinkedIn's (New) Revenue Attribution Report

Transforming ROI Measurement for Our Clients with LinkedIn's (New) Revenue Attribution Report

Hey there, we've been navigating the complex journey of linking our LinkedIn advertising efforts to the tangible outcomes at the funnel's end. The scenario…