June 2024 – Lean

Scaling a telehealth client within 4 years with 30x SEM Growth and 40% higher efficiency

Scaling a telehealth client within 4 years with 30x SEM Growth and 40% higher efficiency

This is the story of how our digital marketing efforts enabled the rapid growth of a telemedicine brand from a startup to market leader, scaling conversions on SEM by 2,985% over the course of 4 years while improving the efficiency by 40%.

In this article, we share the top 5 strategies we used to drive 15% YoY growth even in 2022, despite the challenges of post-covid drop in demand and increase in competition.


Client Overview

Our client is a nationwide virtual primary care provider that offers a quick and simple alternative to traditional health care. With board-certified doctors licensed in all 50 states and high ratings in app stores, they’re on a mission to help everyone live longer, healthier and happier lives.


SEM Growth Throughout the Years

Source: analytical data obtained via Google Ads, 2019 – 2022


2019:  +130% Conversions  |  +35% Spend  |  -40% CPA

“The year we took over the account.” — Immediately we started to focus on optimization and efficient expansion. This resulted in over 100% customer base growth at 40% lower cost per customer compared to 2018. Mainly, the strategies that got us there were better traffic control and orchestrating the user’s keyword-ad-landing page flow which led to 97% CvR boost.


2020:  +440% Conversions  |  +390% Spend  |  -10% CPA

“The year Covid hit.” — In March 2020 the world changed, and so did the telehealth industry. The natural demand for our existing core keywords grew exponentially, but we also drove significant incremental volume by retesting all the keyword themes that didn’t perform in the past. For many initiatives, we finally had enough volume to build more granular structures and further customize the user flow.


2021:  +100% Conversions  |  +165% Spend  |  +30% CPA

“The year Covid continued.” — The industry’s increase in demand was followed by an increase in competition that impacted the CPC. Suddenly, we had doctor chats, symptom checkers, and even Amazon entering the playing field. One of our main strategies focused on ad messaging and repositioning ourselves to stand out in the new competitive landscape, as well as doing extensive landing page testing which led to 12% CvR increase.


2022:  +15% Conversions  |  +/-0% Spend |  -15% CPA

“The year Covid ended…” — As of February it seemed like Covid didn’t matter any more. We got the vaccine, several Covid pills, and life was going back to “normal”. Just look at the search demand diving off a cliff on the trendlines below.

Source: publicly available Google Trends data, 2019 – 2022


So, how did we maintain a flat spend and almost 15% customer growth year-over-year?

Let’s dive in!


The 2022 Challenge & Top 5 Strategies for Success

Without Covid, 2022 was going to be a challenge. We needed to identify new pockets of volume that will help us deliver YoY growth, and we needed to do it fast.

So, we rolled up our sleeves and kept them rolled up in order to stay on top of new keyword expansion opportunities. Here’s the anonymized traffic for a few of our key finds:

Source: anonymized Google Trends data of newly identified keyword themes, 2018 – 2022


To identify these much needed volume-drivers we used the following 5 Strategies:

  1. Scraping competitors keyword for any gaps
  2. Tracking the popularity of specific medical conditions
  3. Using internal business data for month-over-month changes in diagnosis and prescription trends
  4. Following FDA medication approvals
  5. Staying on top of seasonal patterns

Then, we just launched fast, optimized faster, and dug for new expansion opportunities again and again.

Needless to say, we continued to focus on optimizations for ad copy and messaging. This time, we perfected the RSA testing strategies, which brought a 15% CTR increase compared to the previous year.

Conclusion

At LeanSEM, experts run your entire PPC operation better than an in-house team. We execute the right ideas faster and better, delivering meaningful results and insights. Our results speak for themselves, and that’s why clients stay in business with us for 5+ years, while the industry average is around 1-2 years.

But, don’t take our word for it…

Testimonial from the client:

The LEAN team’s technical expertise and strategic mindset were crucial for scaling our business over the last few years. The team is highly responsive and reliable, and their performance reports are in-depth, insightful, and consistently accurate. Beyond the day-to-day management of our account, the team is proactive in exploring new ways to drive volume and efficiency in our account. We highly recommend working with LEAN to drive fast growth in performance channels.


Check out the LeanSEM methodology and brand promise here.


Ivana Janevska

The author

Ivana Janevska

Account Lead and Partner @ Lean

They fired their creative agency and gave the performance creative to the team already running their Google and Meta ads

They fired their creative agency and gave the performance creative to the team already running their Google and Meta ads

Case study · Consumer membership marketplace · Google Ads, Meta and creative Once they'd seen the ownership we took and the results we drove,…
How cutting their  “best-performing” channel grew patients 112% at 52% lower cost

How cutting their “best-performing” channel grew patients 112% at 52% lower cost

Case study · Healthcare · Google Ads and Meta It was their best channel by every number they had. Every number they had stopped…
How the most heavily modelled account we'd inherited was hiding a 43% gain.

How the most heavily modelled account we'd inherited was hiding a 43% gain.

Case study · B2B SaaS · Self-serve signup · Google Ads and Performance Max The machines were doing a great job. The inputs underneath…

How cutting their “best-performing” channel grew patients 112% at 52% lower cost

How cutting their  “best-performing” channel grew patients 112% at 52% lower cost

Case study · Healthcare · Google Ads and Meta

It was their best channel by every number they had. Every number they had stopped too early.

The short answer

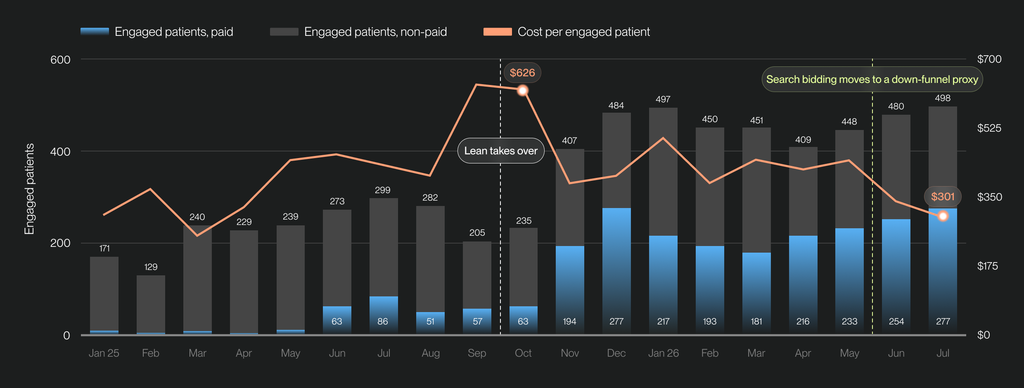
A healthcare business spending up to $250,000 a month had most of it in social, the channel with the best top-of-funnel numbers. Registrations were cheap and plentiful. Almost none became patients. Broken back-end tracking meant nobody could see that. We took over in October 2025, argued for moving the budget to search before anyone could prove we were right, then spent months fixing the tracking so search could bid on a proxy for an eligible patient. Engaged patients went from 235 a month to 498, and cost per patient from $626 to $301.

+112%

Engaged patients per month, 235 to 498

−52%

Cost per engaged patient, $626 to $301

October 2025July 2026Change
Engaged patients per month235498+112%
Cost per engaged patient$626$301−52%
Qualified registrations per month461966+110%
Cost per qualified registration$319$155−51%
Google cost per click$2.02$13.246.5x
Click to qualified registration rate0.93%4.64%5x

Who this is about

A healthcare business spending up to $250,000 a month across search and social. Someone registers, gets screened for eligibility, and then either reaches clinical care or doesn’t. The patient who reaches care is the one the business earns from, so that’s what the account is judged on. We took it over in October 2025, with most of the budget sitting in social.

Their reporting said social was the best channel. It wasn’t.

By every number the client had, social was working. Registrations were cheap and there were plenty of them. What nobody could see was what happened to those registrations afterwards, because the back-end tracking stopped at the sign-up. So the channel producing the most registrations looked like the best channel in the account, and the conversion everyone was judged on wasn’t the one that mattered.

The easy version of this job is to report against that number and hit the target. We told them their best channel was the problem instead, and asked to move the budget before anyone could prove it. If we were wrong we’d have cut their largest source of volume on a judgement call, and it would have been ours to answer for.

Reporting against a number we didn’t believe would have been safer. It wouldn’t have been right.

What made the difference

It took someone with skin in the game

None of this happens unless someone treats down-funnel revenue as their own problem. Reporting on platform data is fast and it always looks fine. Gluing back-end data to platform data by hand takes twice as long and tells you things you’d rather not know. The tracking fix wasn’t a marketing task at all, so it meant twice the meetings with their data team and months of chasing owners outside marketing who had their own roadmaps. An agency logs that as a client dependency and reports the blocker every week. We took it as ours.

We made the call before the data could prove it

We pulled what the back end did hold, filled the gaps with stand-in measures and with what accounts like this one usually do, and argued for a radical change in the budget split. It took a lot of pushing. When the reporting was rebuilt months later it confirmed the call. Search was converting into eligible patients at a rate social never came close to.

We taught search to bid on a proxy for a real patient

Once the tracking held we sent Google a down-funnel signal, a proxy for a registration that would turn out to be eligible. The algorithm stopped optimising for people who fill in a form and started optimising for people who qualify. It also got choosier, which is why cost per click climbed to $13.24. Click to qualified registration went from 0.93% to 4.64%.

Every platform will tell you it’s working. Only the back end can tell you which one is right.

Did the volume hold?

It doubled. 235 engaged patients in October 2025, 498 in July 2026. January against July is the cleanest read: 497 patients on around $250,000 of spend, then 498 on around $150,000. Same output, $100,000 less.

Questions we get asked

Should we move budget out of the channel with the best cost per lead?

Not on platform numbers alone, but don’t trust those numbers either. Check what each channel’s leads do downstream. The channel with the best cost per lead is often the one buying the least qualified people, and the platform will never tell you, because it can’t see past the click.

What do you do when the tracking is broken and you can’t prove which channel works?

You don’t wait. Pull whatever the back end does hold, fill the gaps with stand-in measures, and weigh that against what you’ve seen accounts of this shape do before. Say out loud that it isn’t certain, make the call anyway, and fix the reporting in parallel so you find out whether you were right. Waiting for clean data is a decision too, and usually a more expensive one.

Will optimising on a rarer event starve the algorithm of data?

It can, and that’s the whole reason to use a proxy rather than the final outcome. The event has to sit far enough down the funnel to correlate with value and happen often enough to feed the model.

Is a rising cost per click a bad sign?

On its own it’s neither good nor bad. It’s a price, not an outcome. Read it next to cost per outcome. Here cost per click rose 6.5 times while cost per engaged patient halved, which means the extra money was buying better people.

Client name withheld at the client’s request. All figures are actual reported results for the periods shown. Cost per engaged patient and cost per qualified registration are paid media spend divided by total volume from all sources.

Ivana Janevska

The author

Ivana Janevska

Account Lead and Partner @ Lean

They fired their creative agency and gave the performance creative to the team already running their Google and Meta ads

They fired their creative agency and gave the performance creative to the team already running their Google and Meta ads

Case study · Consumer membership marketplace · Google Ads, Meta and creative Once they'd seen the ownership we took and the results we drove,…
How the most heavily modelled account we'd inherited was hiding a 43% gain.

How the most heavily modelled account we'd inherited was hiding a 43% gain.

Case study · B2B SaaS · Self-serve signup · Google Ads and Performance Max The machines were doing a great job. The inputs underneath…
How 704 ad tests took monthly spend 10x with cost per enrollment down 46%

How 704 ad tests took monthly spend 10x with cost per enrollment down 46%

Case study · EdTech · Meta · Performance creative Nobody can pick the winning ad in advance, so we stopped trying to. The short…