
Case study · Healthcare · Google Ads and Meta
It was their best channel by every number they had. Every number they had stopped too early.
The short answer
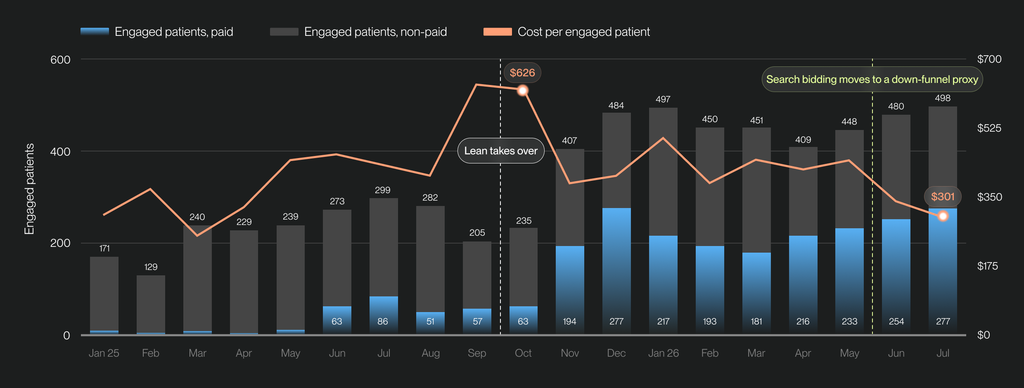
A healthcare business spending up to $250,000 a month had most of it in social, the channel with the best top-of-funnel numbers. Registrations were cheap and plentiful. Almost none became patients. Broken back-end tracking meant nobody could see that. We took over in October 2025, argued for moving the budget to search before anyone could prove we were right, then spent months fixing the tracking so search could bid on a proxy for an eligible patient. Engaged patients went from 235 a month to 498, and cost per patient from $626 to $301.
+112%
Engaged patients per month, 235 to 498
−52%
Cost per engaged patient, $626 to $301
| October 2025 | July 2026 | Change | |
|---|---|---|---|
| Engaged patients per month | 235 | 498 | +112% |
| Cost per engaged patient | $626 | $301 | −52% |
| Qualified registrations per month | 461 | 966 | +110% |
| Cost per qualified registration | $319 | $155 | −51% |
| Google cost per click | $2.02 | $13.24 | 6.5x |
| Click to qualified registration rate | 0.93% | 4.64% | 5x |
Who this is about
A healthcare business spending up to $250,000 a month across search and social. Someone registers, gets screened for eligibility, and then either reaches clinical care or doesn’t. The patient who reaches care is the one the business earns from, so that’s what the account is judged on. We took it over in October 2025, with most of the budget sitting in social.
Their reporting said social was the best channel. It wasn’t.
By every number the client had, social was working. Registrations were cheap and there were plenty of them. What nobody could see was what happened to those registrations afterwards, because the back-end tracking stopped at the sign-up. So the channel producing the most registrations looked like the best channel in the account, and the conversion everyone was judged on wasn’t the one that mattered.
The easy version of this job is to report against that number and hit the target. We told them their best channel was the problem instead, and asked to move the budget before anyone could prove it. If we were wrong we’d have cut their largest source of volume on a judgement call, and it would have been ours to answer for.
Reporting against a number we didn’t believe would have been safer. It wouldn’t have been right.
What made the difference
It took someone with skin in the game
None of this happens unless someone treats down-funnel revenue as their own problem. Reporting on platform data is fast and it always looks fine. Gluing back-end data to platform data by hand takes twice as long and tells you things you’d rather not know. The tracking fix wasn’t a marketing task at all, so it meant twice the meetings with their data team and months of chasing owners outside marketing who had their own roadmaps. An agency logs that as a client dependency and reports the blocker every week. We took it as ours.
We made the call before the data could prove it
We pulled what the back end did hold, filled the gaps with stand-in measures and with what accounts like this one usually do, and argued for a radical change in the budget split. It took a lot of pushing. When the reporting was rebuilt months later it confirmed the call. Search was converting into eligible patients at a rate social never came close to.
We taught search to bid on a proxy for a real patient
Once the tracking held we sent Google a down-funnel signal, a proxy for a registration that would turn out to be eligible. The algorithm stopped optimising for people who fill in a form and started optimising for people who qualify. It also got choosier, which is why cost per click climbed to $13.24. Click to qualified registration went from 0.93% to 4.64%.
Every platform will tell you it’s working. Only the back end can tell you which one is right.
Did the volume hold?
It doubled. 235 engaged patients in October 2025, 498 in July 2026. January against July is the cleanest read: 497 patients on around $250,000 of spend, then 498 on around $150,000. Same output, $100,000 less.
Questions we get asked
Should we move budget out of the channel with the best cost per lead?
Not on platform numbers alone, but don’t trust those numbers either. Check what each channel’s leads do downstream. The channel with the best cost per lead is often the one buying the least qualified people, and the platform will never tell you, because it can’t see past the click.
What do you do when the tracking is broken and you can’t prove which channel works?
You don’t wait. Pull whatever the back end does hold, fill the gaps with stand-in measures, and weigh that against what you’ve seen accounts of this shape do before. Say out loud that it isn’t certain, make the call anyway, and fix the reporting in parallel so you find out whether you were right. Waiting for clean data is a decision too, and usually a more expensive one.
Will optimising on a rarer event starve the algorithm of data?
It can, and that’s the whole reason to use a proxy rather than the final outcome. The event has to sit far enough down the funnel to correlate with value and happen often enough to feed the model.
Is a rising cost per click a bad sign?
On its own it’s neither good nor bad. It’s a price, not an outcome. Read it next to cost per outcome. Here cost per click rose 6.5 times while cost per engaged patient halved, which means the extra money was buying better people.
Client name withheld at the client’s request. All figures are actual reported results for the periods shown. Cost per engaged patient and cost per qualified registration are paid media spend divided by total volume from all sources.