Case study · B2B SaaS · Self-serve signup · Google Ads and Performance Max
The machines were doing a great job. The inputs underneath them didn’t match the business.
The short answer
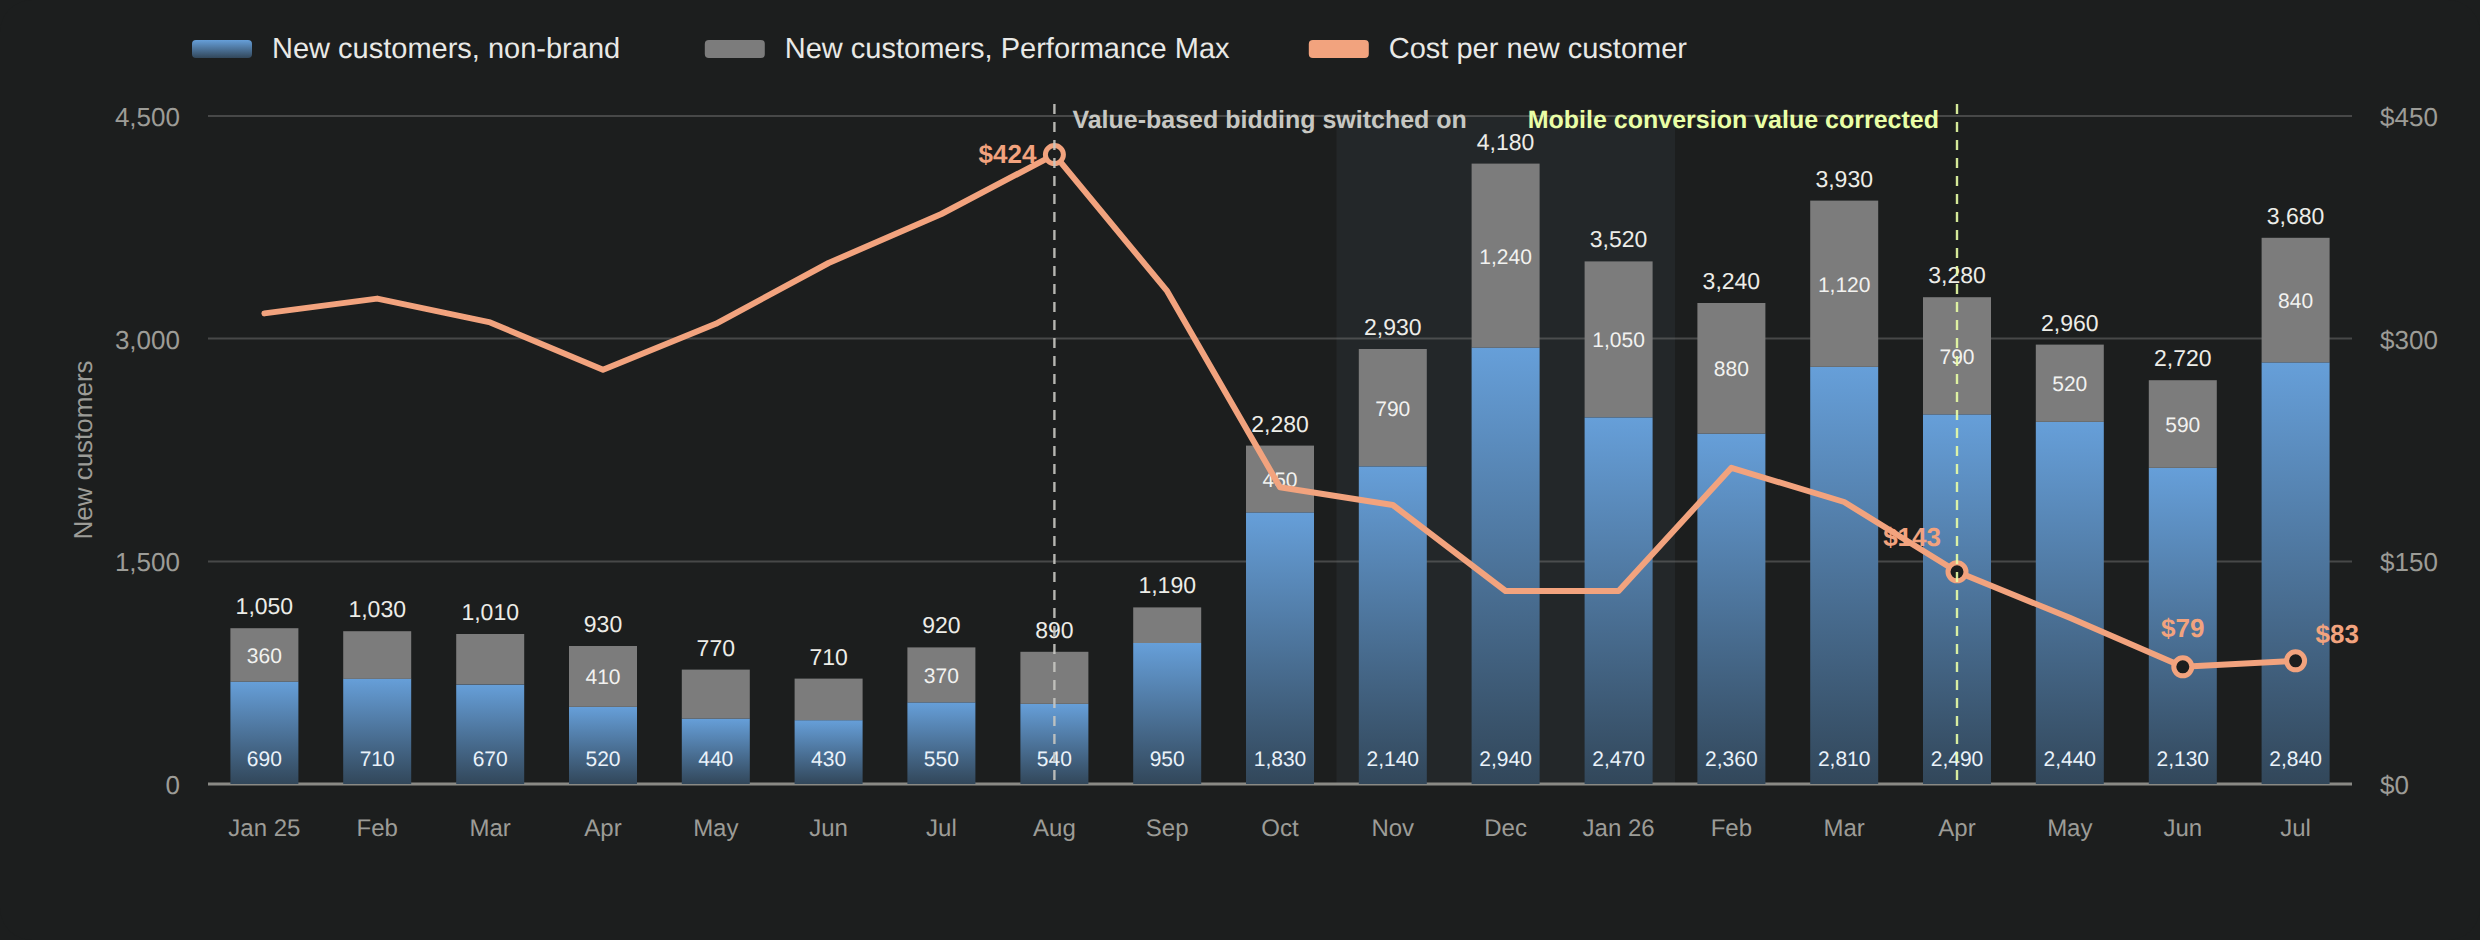
A B2B SaaS platform spending around half a million dollars a month handed us one of the more heavily modelled bidding setups we’d taken over. Value-based bidding since the previous August, on a prediction model reading hundreds of signals. All of that was the right call. What none of it could do was check its own inputs. The value assigned to mobile conversions didn’t match what mobile signups were worth downstream. We adjusted it in April 2026, and by June cost per new customer was down 48% on Performance Max and 43% on non-brand search, the lowest in nineteen months.
~$500K
Monthly paid media spend
−43%
Cost per new customer, $143 to $81
| April 2026 | June and July 2026 | Change | |
|---|---|---|---|
| Cost per new customer, non-brand | $138 | $78 to $83 | −40 to −43% |
| Cost per new customer, Performance Max | $157 | $82 | −48% |
| First-month cohort ROAS, non-brand | 0.05x | 0.09 to 0.10x | 2x |
| First-month cohort ROAS, Performance Max | 0.04x | 0.09 to 0.10x | >2x |
Wasn’t the model supposed to catch this?
Fair question, and the answer matters. The automation wasn’t the problem. An account this size can’t be run without it, and running paid media now without every model you can get is money left on the table.
You can see it working on the chart. Value-based bidding went live in August 2025 and cost per new customer fell from $424 to $130 by December. That was the client’s own move, before we arrived, and it was the right one.
But a model can only bid on the values it’s given. It can’t know when one of them is wrong, because the proof sits in back-end data it never sees. Someone has to bring that number to it.
The model wasn’t wrong. It was optimising accurately toward a value that didn’t match the business.
Who this is about
A B2B SaaS platform with a self-serve signup and a usage-based product. Someone signs up, connects their systems, makes a first purchase, and if the product fits they keep buying for years. That first purchase is where a signup becomes a real customer, so the account is judged on it alongside transaction volume and cohort user counts.
We took the account over in April 2026. ROAS on this page means first-month cohort revenue divided by acquisition spend, which is a leading indicator in a business where value accrues over years, not a payback figure.
What made the difference
We audited what the model had been told, not how it was tuned
The instinct with an underperforming automated account is to tune it. Adjust the targets, add another tool, restructure the campaigns. We went the other way and looked at the inputs.
Put the platform’s valuation next to the business’s own outcomes, segment by segment, and look for where the two disagree. That’s the method. We ran it across first purchases, transactions and cohort users, broken out every way the account could be split. In one dimension the two had been disagreeing for months. Here it was device. In another account it could be geography, landing page or time of day.
The fix was a value adjustment, not another tool
Mobile conversions were being priced as though they were worth what desktop ones were. The back-end numbers said otherwise, so we adjusted the value assigned to mobile and let the model reallocate on its own. No restructure, no new platform, no extra layer. One correction to a price the system had been carrying since before we arrived.
The model optimises. Someone still has to decide what it’s optimising toward.
Did that cost us volume?
No. July 2026 brought in roughly as many new customers as March 2026 did, on around 40% of the spend.
The June and July figures aren’t only better than April either. They’re the best in the whole nineteen-month series. Combined cost per new customer had never gone below $130 before, and that came in December and January, the peak of the season. June and July beat it in the quiet months.
Questions we get asked
Should we be running more automation or less?
It depends on how rich your signals are. If you have a lot of them, and they’re varied, use as much value-based bidding and predictive modelling as you can get, because that’s where the compounding is. If the data is thin, more modelling on top won’t invent signal that isn’t there. One thing worth knowing either way: a platform’s own model can only work with what you can feed it. In this account a separate model was used because there was no way to get every signal into Google’s.
Can a value-based bidding model find every optimisation on its own?
No. A model reading hundreds of signals ranks and bids inside the values it’s been given. It can’t tell you that one of those values is wrong, because the evidence for that sits in back-end data the platform never sees. Here a heavily modelled setup ran for months while one conversion value stayed mispriced, and correcting it was worth 40 to 48% of acquisition cost.
How do you find a gap like this in an account that’s already modelled?
Put the platform’s valuation next to the business’s own outcomes, segment by segment, and look for where the two disagree. The model is only as good as what it’s been told each conversion is worth, and it has no way to audit that input. In this account the disagreement showed up on device. In the next one it could be geography, landing page or time of day.
What does a person add to an account already running advanced automation?
The judgment about what the machine should be aiming at, and the work of connecting paid media to business outcomes. Models and third-party tools find patterns inside a defined objective very well. They don’t audit whether the objective matches the business, because that means comparing platform behaviour against revenue data the platform can’t see. In mature accounts that comparison is where most of the value left on the table sits.
Client name withheld at the client’s request. All figures are actual reported results for the periods shown. ROAS refers to first-month cohort revenue divided by acquisition spend and is used as a leading indicator, not a measure of payback.